Datadog Monitoring Alerts

How to add a Datadog Monitor? How to send Datadog monitoring alerts?
In this tutorial, it is a prerequisite that you have your Datadog Agent and APM already setup in your host and application. If you have not done this yet, please read my tutorial first on how to install Datadog agent to monitor your server. Also, you can read my tutorial about Datadog APM for monitoring Applications.
Datadog Monitors
Datadog allow you to build monitoring alerts around the data it collects from your host and application. It supports several types of monitoring such as Host, Metric, APM, Composite, Logs and more.
In this tutorial, I wanted to focus on the monitors I mentioned above since I find it easy to setup yet very useful in keeping your host and application in check all the time. So let’s get started!
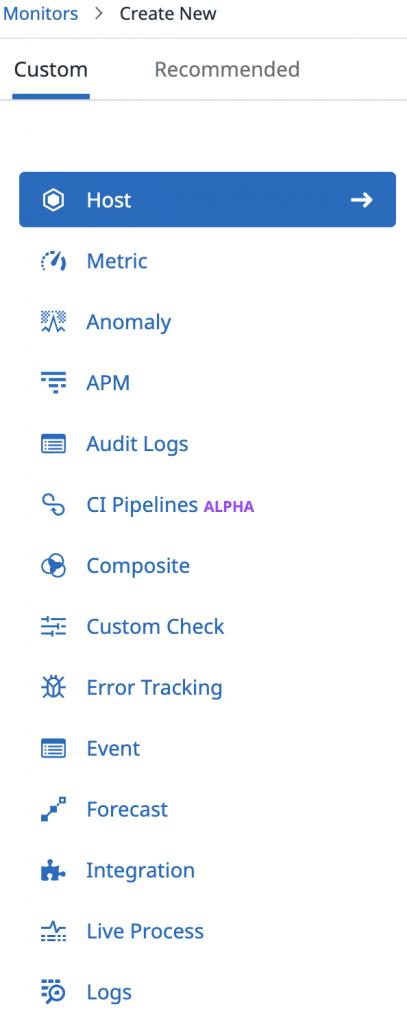
To create new monitor in your Datadog account, navigate to Monitors, then New Monitor. You will find several options for creating a custom monitor.
Datadog Monitors – Host
Host monitoring allows you to create alerts if one or more of your hosts stop sending metrics to Datadog. Running Datadog agent on your host server reports back a status check that gives an indication if your server is responsive or when it is down.
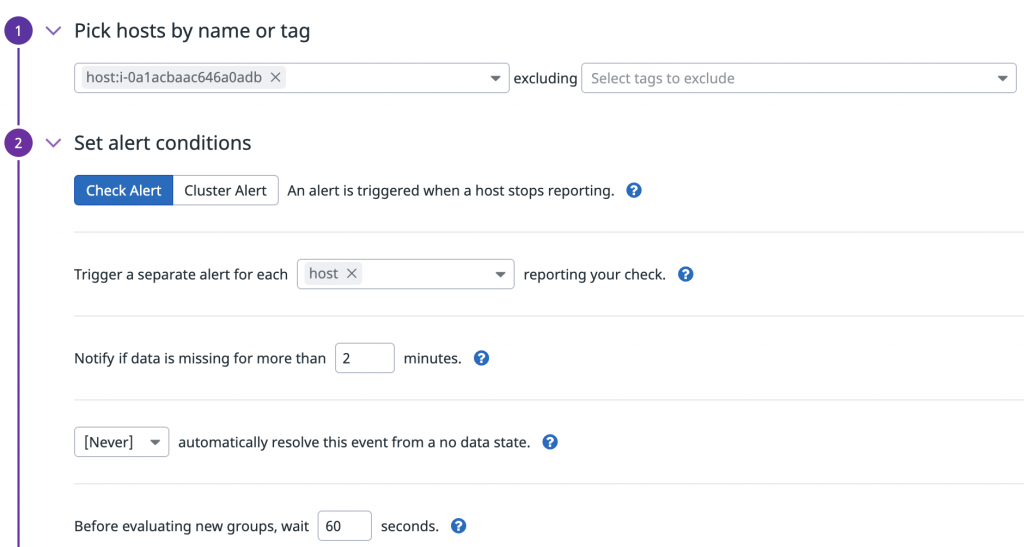
Select a single host to monitor or you can set an alert for a cluster of hosts using tag. Similarly, you can use tag to exclude a group of hosts. Once you picked your host(s), you can set the duration on when to trigger the alert. For instance, trigger the alert if a host stopped sending data for more than two minutes.
Datadog Monitors – Metric
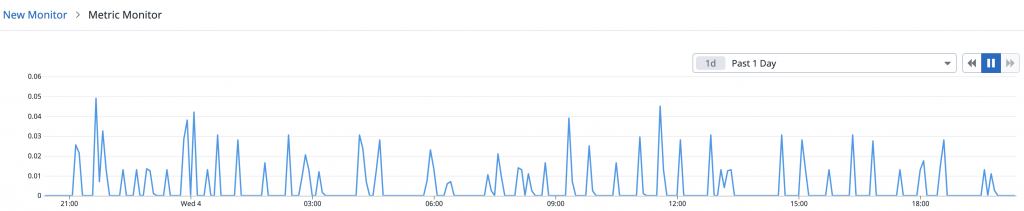
Use Metric monitor to send alert when a threshold that you set has been reached against the data collected from your host.
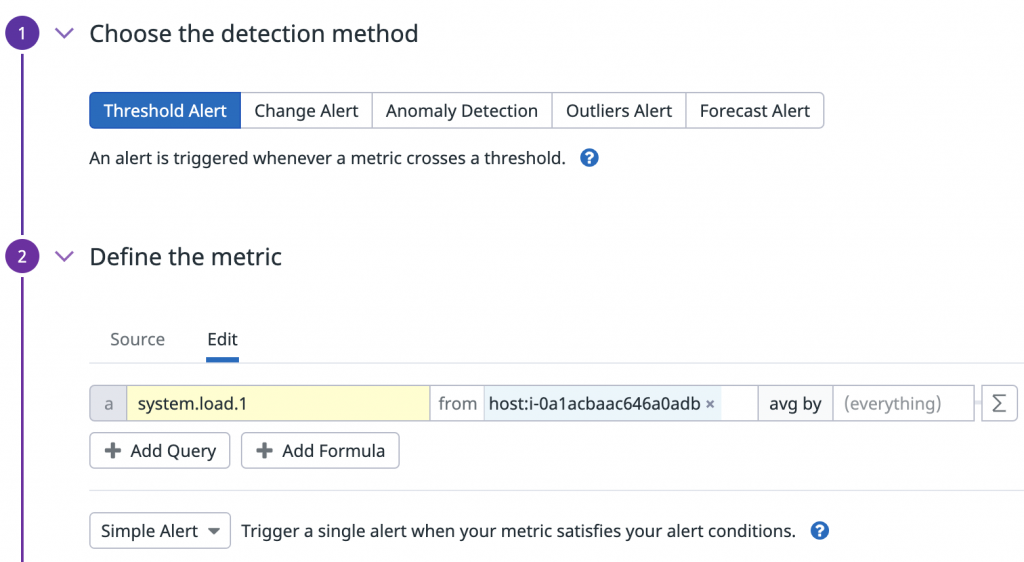
You can choose from predefined metrics like system load and network performance or define your own.
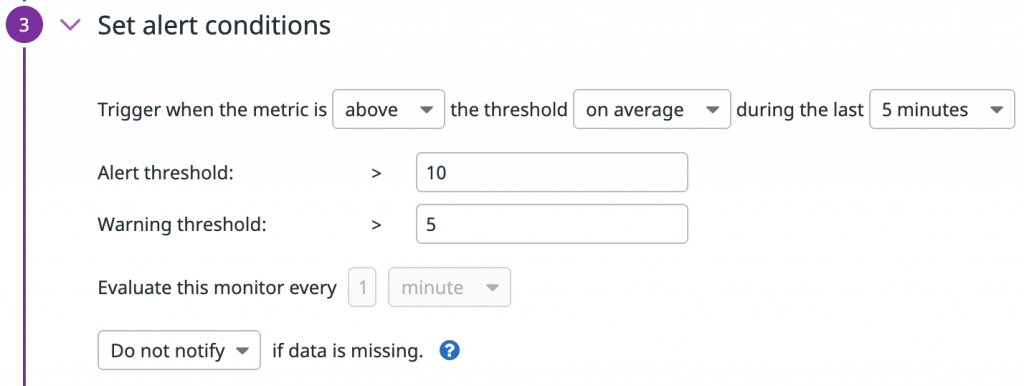
Set the alert conditions. You can send an alert when a threshold has been reached or send a warning before it even hits the threshold.
Datadog Monitors – APM
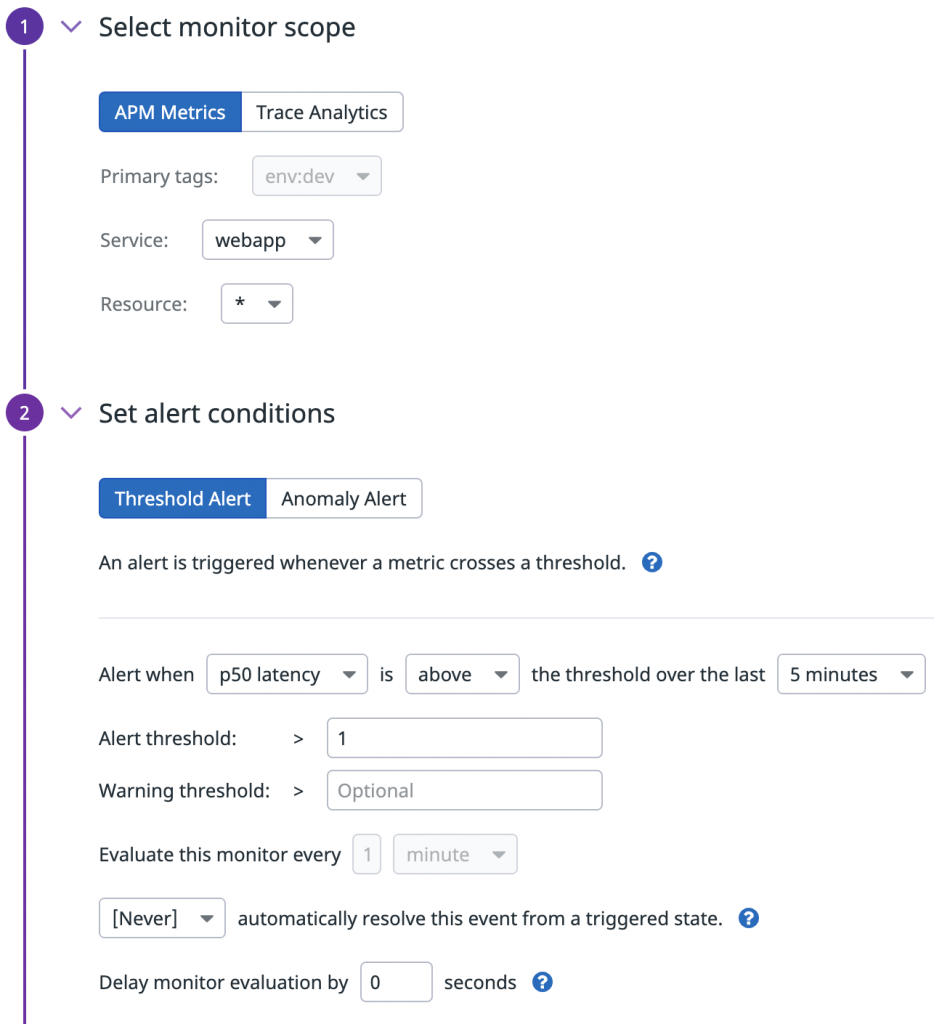
Use APM monitor to send alert when a threshold that you set has reached the limit against the data collected from your application. For example, you can set a threshold based on latency, error rate or requests per second. You can also set an alert based on anomaly when a metric deviates from an expected pattern.
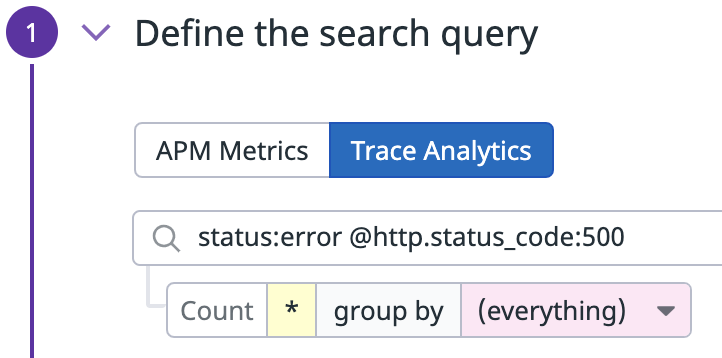
What I like about APM monitor is that you can also define your own search query. In the example above, I am able to query all HTTP request errors that has status code 500.
Datadog Monitors – Composite
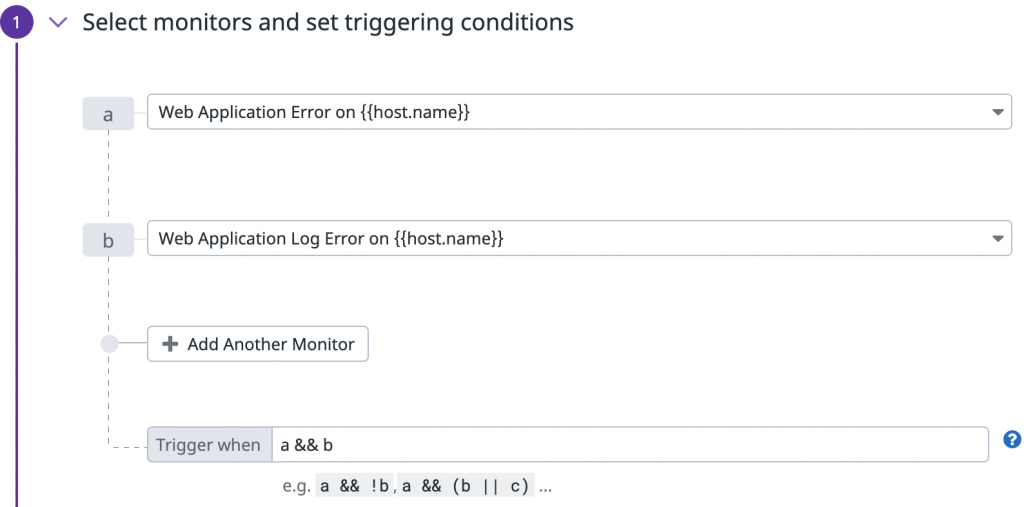
With Composite monitor you can combine multiple monitors to create an alert. For example, you have a complex alert condition based on different types of query, metric or monitor that gets the data from different integration source in Datadog. This kind of scenario makes the composite monitor useful by allowing you to combine independent results from different monitors and create a conditional statement based on those.
Datadog Monitors – Log Monitor
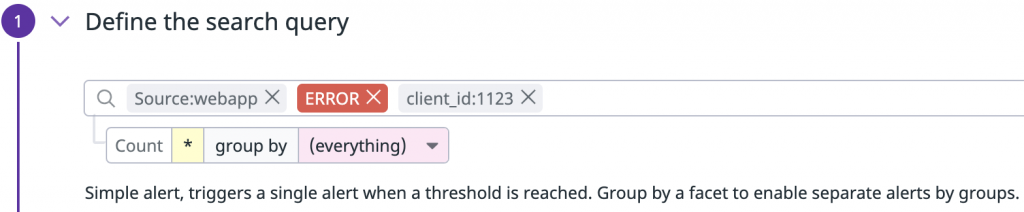
Watch for log messages based on search query that you define. Log monitor will count the occurrence of the log message and trigger the alert when it go over the set threshold.
Datadog Monitor – Sending Alerts
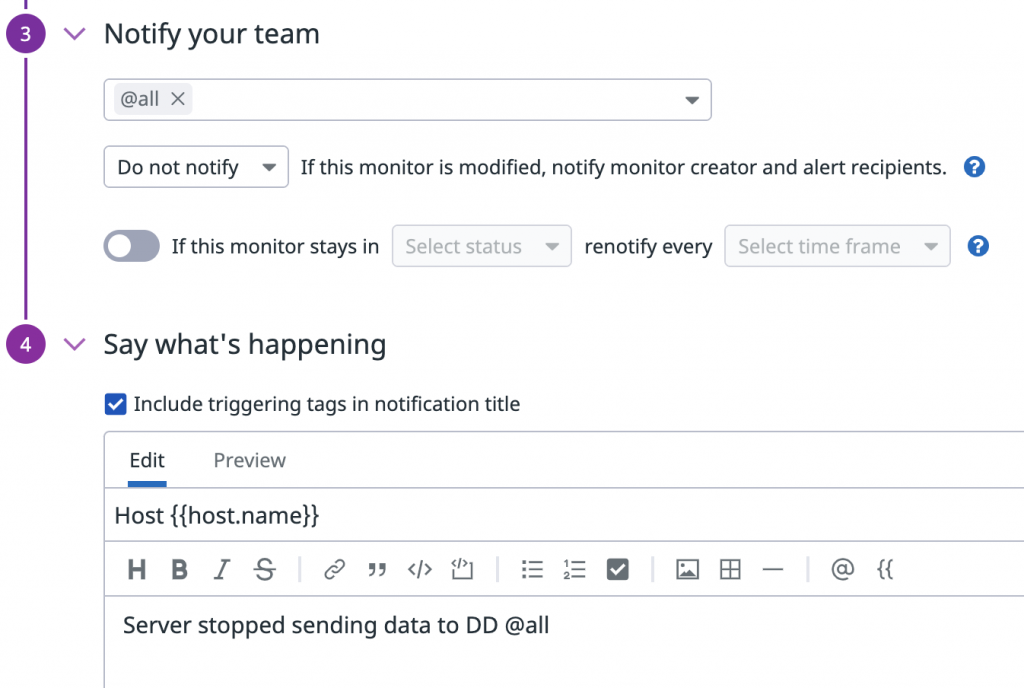
When a monitor is triggered, you can configure who should get the notification. You can send to an individual, group or all members in your account. You can also use message template variables to add information about the host like the host.name and host.ip.
For more advanced monitoring integrations, please see the full list of Datadog monitoring types.