Datadog Logs and APM Trace Injection

How to correlate Datadog Logs with APM Trace Injection? How to enable Logging in Datadog Agent?
This is a continuation of my tutorial about Datadog APM. If you have not installed Datadog Agent in your server, please read my tutorial about Install Datadog Agent to monitor your server. Setting up Datadog traces to monitor your application is a prerequisite for this tutorial. If you have not done this, please read the first part of my tutorial about Datadog APM.
Now that we are able to collect metrics and traces, the next thing we want to do is to collect logs from an application and to correlate these with valuable data across Datadog monitoring.
Datadog Log Management Integration
To start collecting logs, we need to enable another service in Datadog called Log Management. Sign-In to your account and go to Logs section. The onboarding page will ask where your logs will come from.
There are several ways that you can set up your Log collection integrations depending on your platform. Your log collection can come from a host, application, container, serverless and cloud integration (for AWS, Azure, Google Cloud and Heroku).
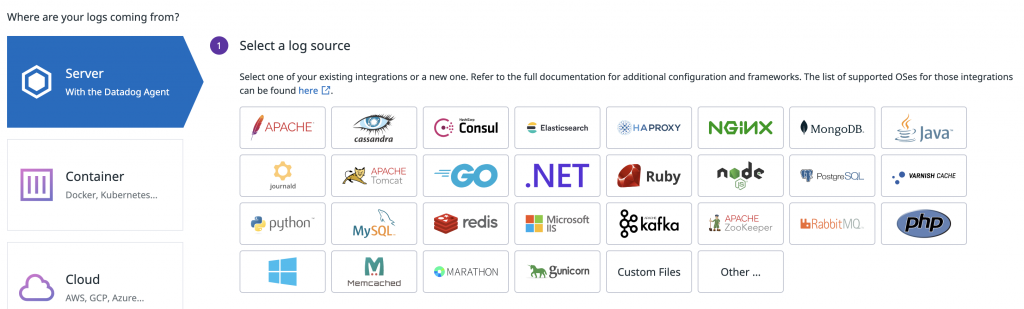
For this tutorial, I have prepared an Amazon Linux server. A Python web application. And a Uvicorn web server. Also, I installed ddtrace library, a Datadog APM client for Python application.
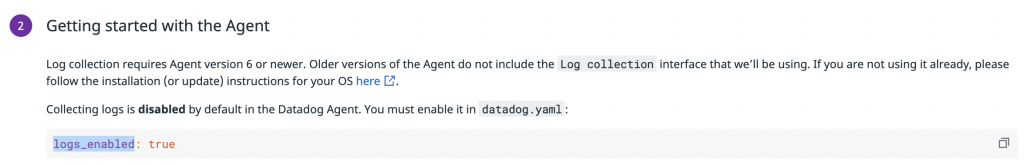
First, I need to enable the service in my Datadog agent by modifying the /etc/datadog-agent/datadog.yaml configuration file. Uncomment the line # logs_enabled: false and set the value to true.
logs_enabled: true
Next, create a file conf.yaml in the Agent’s /etc/datadog-agent/conf.d/ directory with the following configuration:
#Log section
logs:
  - type: file
    path: /var/log/webapp/python/log.log
    service: webapp
    source: python
    sourcecategory: sourcecode
Then restart the system process of Datadog agent.
sudo systemctl restart datadog-agent
In my configuration above, Datadog will read my log messages from a file, in a specified path /var/log/webapp/python/log.log.
APM Trace Automatic Injection for JSON format logs
The easiest (and cleaner) way to integrate APM trace in your logs is by automatic Injection. Enabling Log Injection and monkey patching ddtrace-run to run your web application server is the most straightforward way to do this. You just need to add an environment variable DD_LOGS_INJECTION=true and restart your web application server.
#!/bin/bash

export DD_SERVICE="webapp"
export DD_ENV="dev"
export DD_VERSION="1.0.0"
export DD_LOGS_INJECTION=true
export DD_TRACE_ENABLED=true
export WEBAPP_HOST="0.0.0.0"
export WEBAPP_PORT="8080"

poetry run ddtrace-run uvicorn webapp.main:app --host "$WEBAPP_HOST" --port "$WEBAPP_PORT"
In my example bash script, I set my ddtrace configurations first. And then, I prepended ddtrace-run before the command for running my Uvicorn server.
Then, once enabled, using the built-in logging module in Python, we can start sending log messages to Datadog. And it will be correlated to APM metrics and traces. Notice that I am using pythonjsonlogger, a JSON formatting library, to format the output of my log messages into JSON. Also, I am pointing my file handler to write my log messages to the same file /var/log/webapp/python/log.log I specified in my Datadog configuration.
import logging
import requests
import time

from pythonjsonlogger import jsonlogger
from fastapi import FastAPI

app = FastAPI()

logHandler = logging.FileHandler(filename='/var/log/webapp/python/log.log')
formatter = jsonlogger.JsonFormatter('%(asctime)s %(levelname)s [%(name)s] [%(filename)s:%(lineno)d] %(message)s')
logHandler.setFormatter(formatter)

log = logging.getLogger()
log.addHandler(logHandler)
log.setLevel(logging.DEBUG)

@app.get("/")
async def root():
    extra = {"client_id": "1123"}
    log.info("Happy DD Logging!", extra=extra)
    log.debug("Debug mode loggging")
    return extra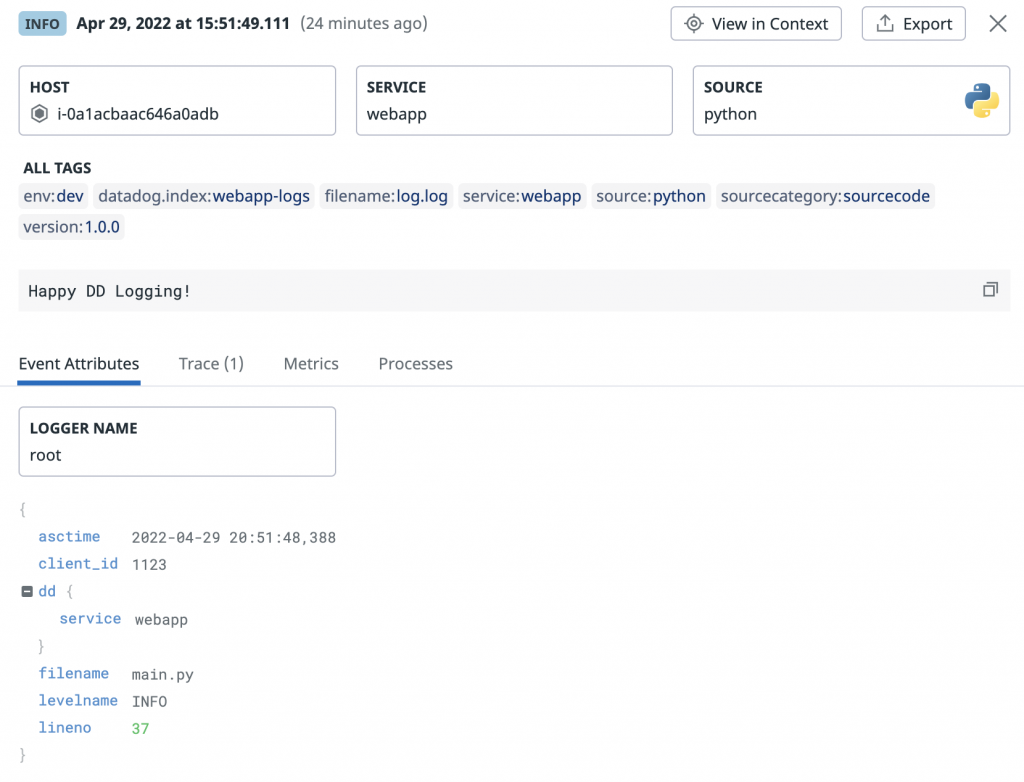
Above is an example collected log from my web application and displayed in my Datadog log management dashboard. You can see here the message “Happy DD Logging!”. Also, the service it is correlated to “webapp”. And you can see also the Event Attributes that were sent along with the log message.
APM Trace Manual Injection for Non-JSON format logs
If you are not using any of the JSON formatting libraries or the Structlog, another way to correlate traces to your logs is by manual injection. To do this, I need to manually apply the dd.* value in the standard library logging by passing the parameter format to basicConfig.
import logging
import requests
import time

from fastapi import FastAPI

app = FastAPI()

FORMAT = ('%(asctime)s %(levelname)s [%(name)s] [%(filename)s:%(lineno)d] '
          '[dd.service=%(dd.service)s dd.env=%(dd.env)s dd.version=%(dd.version)s dd.trace_id=%(dd.trace_id)s dd.span_id=%(dd.span_id)s] '
          '- %(message)s')

logging.basicConfig(format=FORMAT, filename="/var/log/webapp/python/log.log")
log = logging.getLogger(__name__)
log.setLevel(logging.INFO)

@app.get("/")
async def root():
    extra = {"client_id": "1123"}
    log.info("Happy DD Logging!", extra=extra)
    log.debug("Debug mode loggging")
    return extra
The log message in log.info("Happy DD Logging!") should appear in my Datadog Logs.
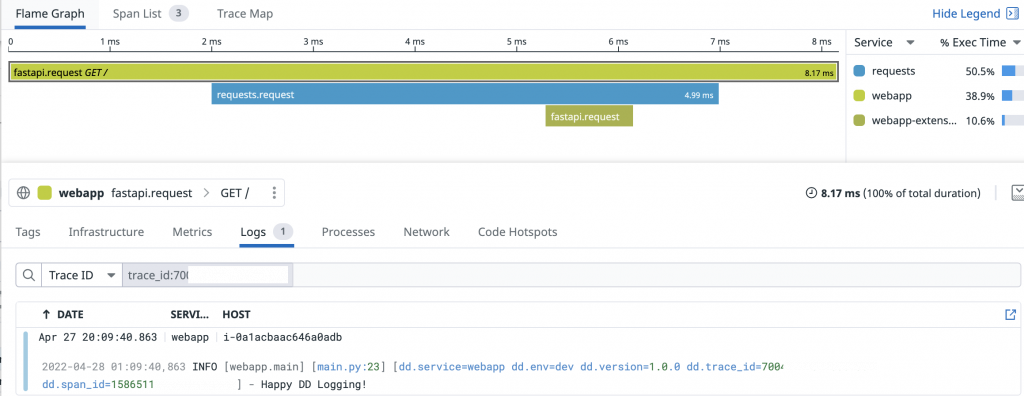
Also, the logs will be associated to my webapp APM along with the traces and metrics.
Datadog Logs not working after integration
==========
Logs Agent
==========

    Reliable: Sending compressed logs in HTTPS to agent-http-intake.logs.datadoghq.com on port 443
    BytesSent: 0
    EncodedBytesSent: 0
    LogsProcessed: 0
    LogsSent: 0

  python
  ------
    - Type: file
      Path: /home/ec2-user/logs/webapp/python/log.log
      Status: Error: cannot read file /home/ec2-user/logs/webapp/python/log.log: stat /home/ec2-user/logs/webapp/python/log.log: permission denied
      BytesRead: 0
      Average Latency (ms): 0
      24h Average Latency (ms): 0
      Peak Latency (ms): 0
      24h Peak Latency (ms): 0
If you are not getting any Datadog Logs or your APM Trace Injection is not working, make sure that you restarted the Datadog agent and it’s running. Also, it will help if you check the output from sudo datadog-agent status . For example, If your log file has permission issue, you will see an error in the “Logs Agent”.