Datadog Log Indexes and Facets
How to filter ingested logs in Datadog for managing your monthly threshold and budget? How to add facets for searching Datadog logs?
This tutorial will discuss on how you can create Datadog Log Indexes and Facets in your account. First, you will need to enable the Datadog Log Management service and integrate this to your platform. If you have not done this yet, please read my tutorial about Datadog Log Management and APM Trace Injection.
Use Datadog Indexes to Limit Retained Logs
When monitoring your server and application, you would want to send all metrics and logs as much as (reasonably) possible to improve visibility. Although when it comes to limiting the cost, we don’t want our platform to be concerned about which logs are ingested and retained.
Datadog has an Indexes feature that allows you to manage incoming logs. Your application can send logs at-will and manage the filtering inside Datadog. Set an exclusion rule and identify which logs are valid for retention.
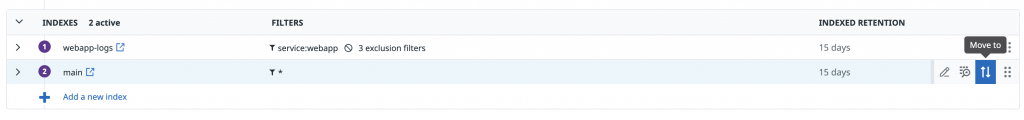
To add an index in Datadog, go to Logs, Configuration, and under the Indexes tab. By default, you will see the main index and notice that its filter is set to *. Also, the main index does not have any exclusion rule. This means that it will accept all incoming logs.
Example Datadog Log Index
Below is an example index for my web application logs.
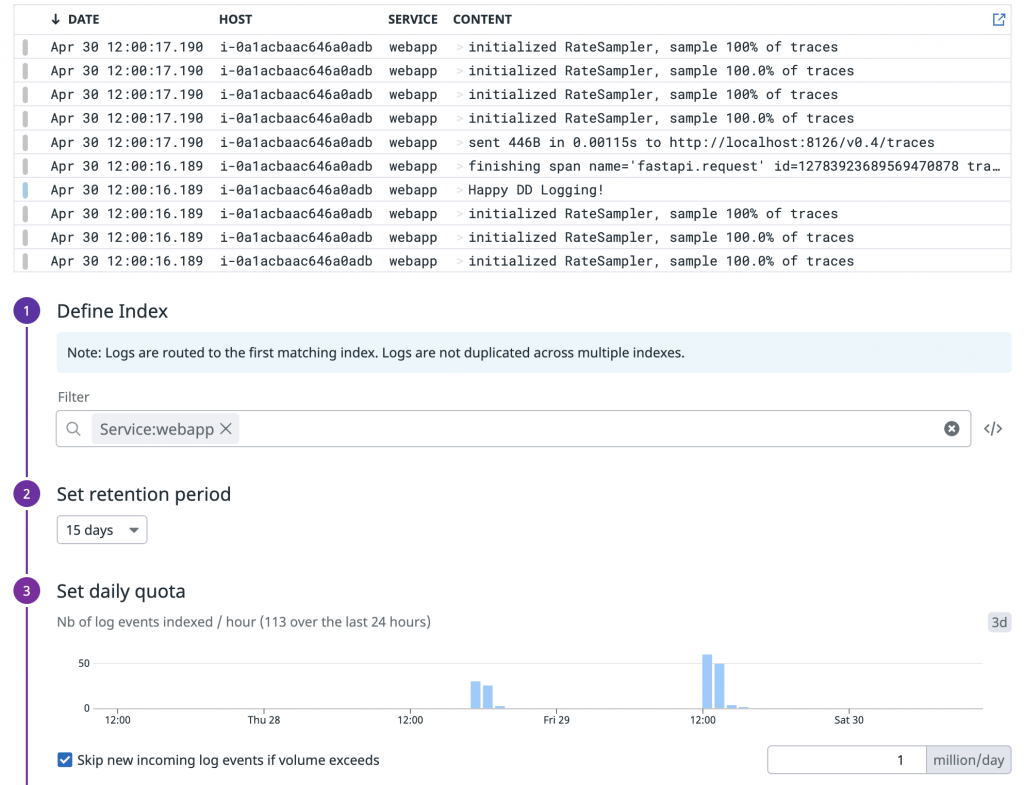
Let’s go over in detail how I created my index. Click on “Add a new index”. First, apply the Filter to manage ingested logs. Here I used the “Service” with name “webapp”. You will also see above the filter a live trail of logs as you apply your filter query. Second, is the retention period. How long you want to keep the ingested logs in Datadog. In this example, I set the value to “15 days”. Third, is setting a daily quota. If you want to set a hard limit on your logs per day. In here, if I hit my daily quota of 1 million logs per day, Datadog will stop ingesting logs for this specific Index.
Add Datadog Indexes Exclusion Rules
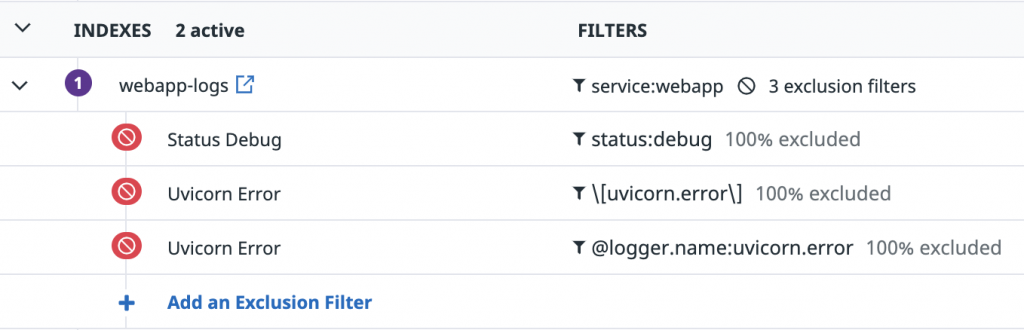
Inside my webapp-logs index, I added several exclusion rules. Any Incoming logs that matches my exclusion rule will be discarded. This is helpful to avoid exceeding your budget by excluding logs that you don’t need. Also, I recommend to add a separate rule per facet for granularity. That way, you can enable or disable each exclusion rules as needed. In my example, I have separated my rules for Status (Debug), Logger Name and Web Server error.
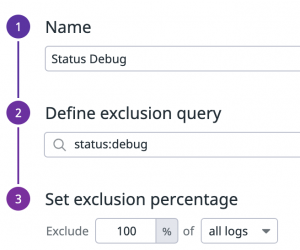
In above example, I named my rule “Status Debug”. By using the facet @status, I am querying all logs that have debug level. And the action is to exclude 100% of the logs that matches my query.
When adding a new index, keep in mind that logs are routed to the first matching index. Logs are not duplicated across multiple indexes. The default index “main” is a catch all rule. You will have to move this at the bottom of your rules.
Use of Log Facets for Searching Logs
We are able to use facets for Indexing Logs, but what about using this also for searching logs in general? For instance, you need to find log messages to verify that a process in your application has succeeded or an error has occurred.
We can also use the facets for searching logs. You can use standard attributes that are automatically created based on your infrastructure and integrated applications. For example, you can search by Indexes, host sever, log level of your application, the name of your container or pods in a Kubernetes cluster, and so on.
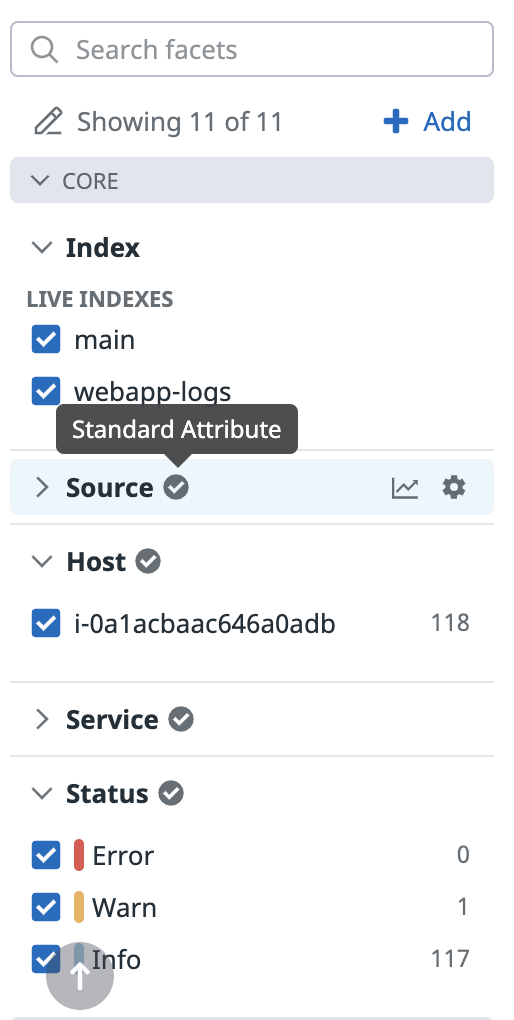
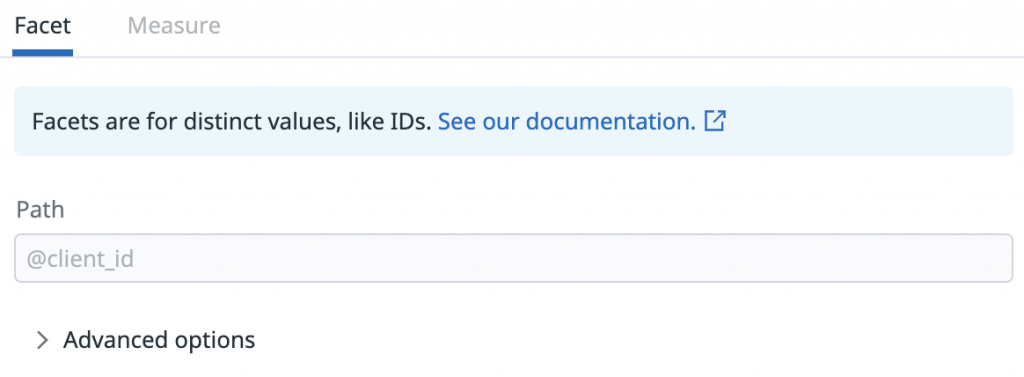
Aside from standard-attributes, you can also use a user-defined ones. You can add your own facet and map this to the event attributes in your logs. Event attribute is added to your logs after being parsed in the Pipeline. In this example I added client_id and mapped this to the value in my JSON formatted logs.
On how to send JSON formatted logs in Datadog, please read my tutorial about APM Trace Automatic Injection for JSON format logs.
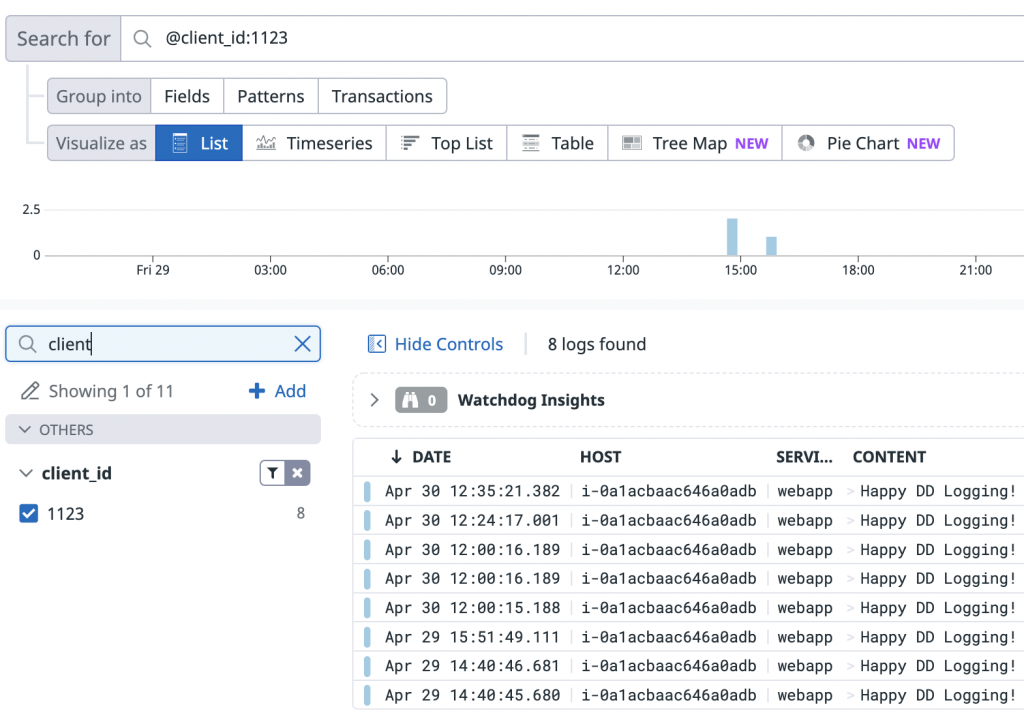
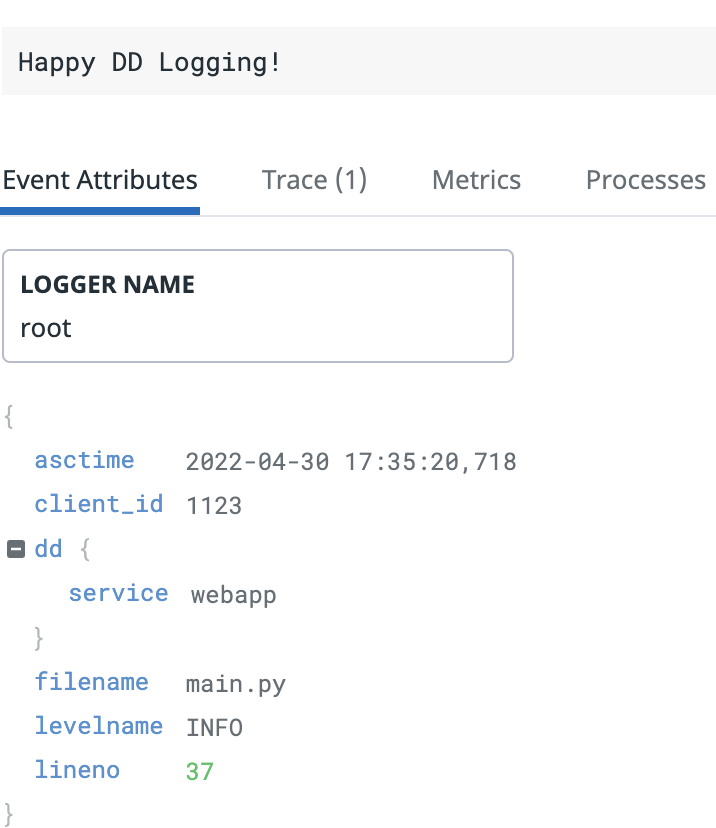
In the example above, I used my user-defined facet client_id that has a value of “1123” to search for all logs in my web application.
Let’s wrap up our discussion about Datadog Log Indexes and Facets. Just remember that an Index is a configuration to filter ingested logs and to manage retention period. Facet on the hand, are simply defined tags and attributes that you can use as search parameters to query your logs.