Datadog Application Performance Monitoring (APM)

How to configure Datadog APM to monitor a Python web application? How to configure Datadog traces in your application?
In my last blog post I discussed on how to Install Datadog Agent to monitor a server. This time, we will look into Datadog APM Client. The APM client sends the traces to the Datadog Agent’s local endpoint, then it forwards the collected metrics to Datadog.
APM allows you to monitor many aspects of your application such as logs, alerts, requests, latency and error rates. You can view and follow the traces in between your applications to find the root cause of errors across front-end, network and back-end requests made to your application.
Setup a Python web application
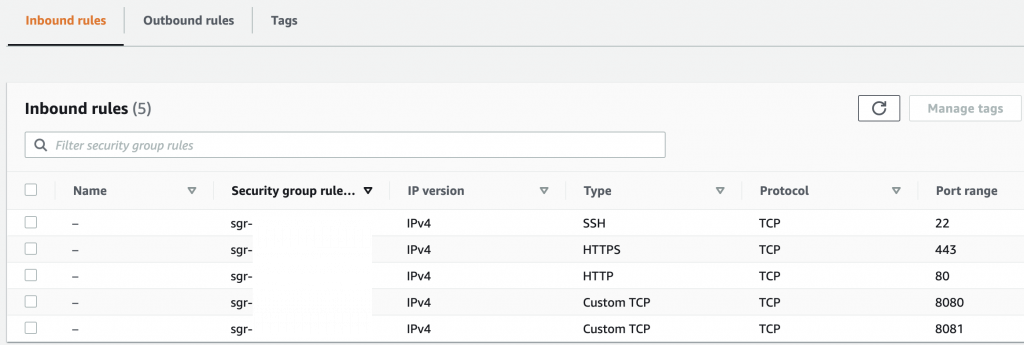
For this tutorial, I deployed an EC2 Instance using an Amazon Linux Image. I also added two custom TCP inbound rules to my security group for ports 8080 and 8081. I will be using these ports to access my web applications to show incoming traffic and trace map in APM dashboard.
To follow along, if you want to use the same web applications from this tutorial, you may pull this from my Git repository. There are two folders in this repository. The main application is webapp and the second one is webapp-extension. To install the library dependencies, you will have to install Python Poetry first.
curl -sSL https://raw.githubusercontent.com/python-poetry/poetry/master/get-poetry.py | python3
Once you have installed Poetry, you will need to load the configuration in your shell. And then install all dependencies listed in pyproject.toml file.
source $HOME/.poetry/env
cd /path/to/webapp
poetry install
cd /path/to/webapp-extension
poetry install
Another important note is that I’m using Uvicorn, a ASGI web server implementation for Python, to run my web application.
uvicorn webapp.main:app --host 0.0.0.0 --port 8080
Please see the file run-webapp.sh for complete example on how to run the web applications for this tutorial.
Install APM In Python Web Application
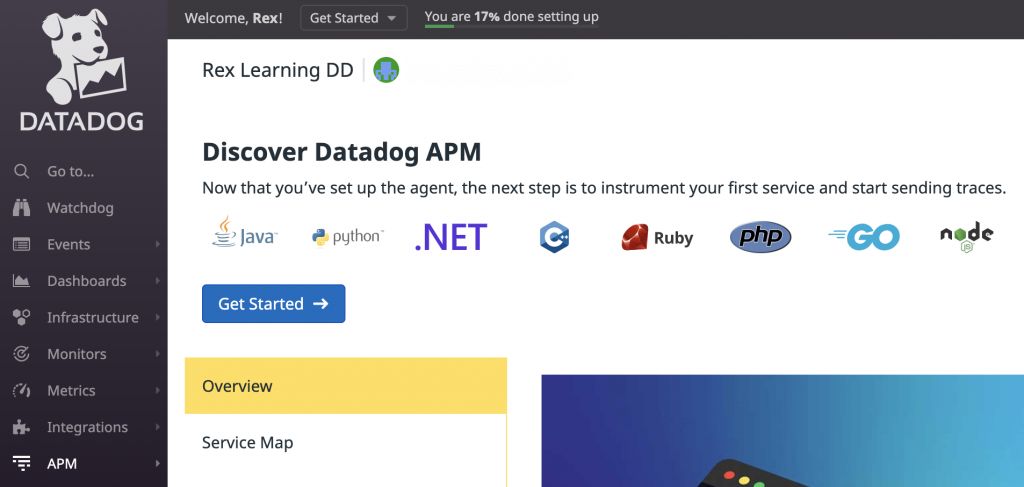
Now let’s get started and set up our first APM! Go to the APM page in your Datadog account. Click on the “Get Started” button.
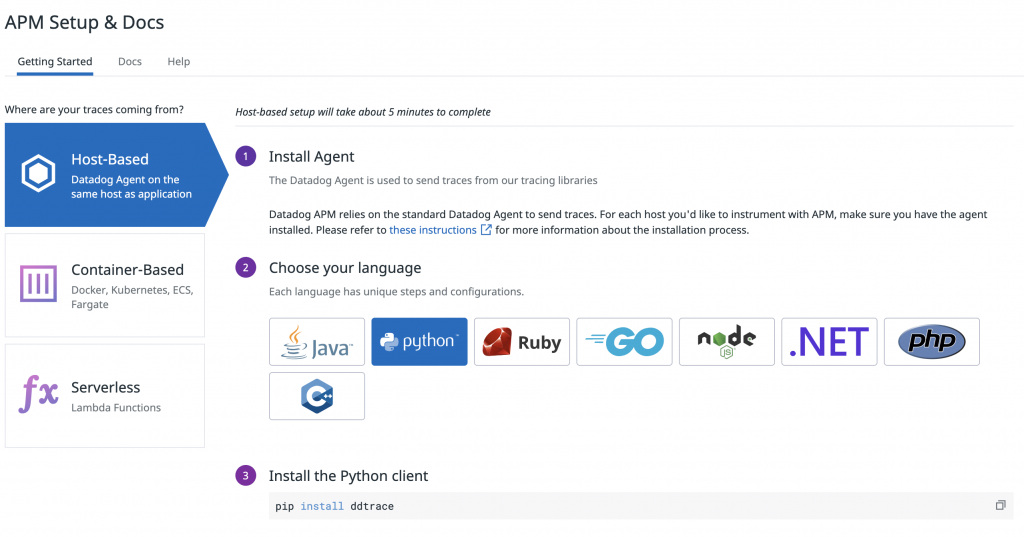
There are multiple options on how you can enable tracing in your application. It could be Host-Based, Container-Based or Serverless (Lambda function). For this tutorial, I will show you the Host-Based set up for a Python web application.
For Python integration, Datadog is using the ddtrace client library. I’m going to install the package using Poetry.
poetry add ddtrace
Let’s take a moment to discuss the step “Instrument your application”. This step provides you an interactive way to build your configuration snippet for enabling tracing in your application. By default, it includes three environment variables.
- DD_SERVICE – The name your service will display within the Datadog UI. You can specify here the name of your application. For this tutorial, I named it “webapp” and “webapp-extension”
- DD_ENV – The name of your application environment. For example “dev”, “qa”, “staging”, “prod” or anything that best describe where your application is running.
- DD_LOGS_INJECTION – Correlates the log messages and traces in your application. Set to True to enable Log injection.
DD_SERVICE="webapp" DD_ENV="dev" DD_LOGS_INJECTION=true ddtrace-run python my_app.py
Above is an example configuration snippet generated in my account. You may set the environment variable along with the ddtrace-run command. But ideally, these environment variables can also be set during deployment of your application. For example, you can set the value of these in your CI/CD pipeline. Or if you are deploying a containerized application in Docker or Kubernetes, you can define these in your YAML configuration.
Use ddtrace-run On Uvicorn ASGI Web Server
#!/bin/bash

export DD_SERVICE="webapp"
export DD_ENV="dev"
export DD_LOGS_INJECTION=true
export WEBAPP_HOST="0.0.0.0"
export WEBAPP_PORT=8080

poetry run ddtrace-run uvicorn webapp.main:app --host "${WEBAPP_HOST}" --port "${WEBAPP_PORT}"
To simulate a real world application deployment, I created a bash script called run-webapp.sh where I can define these three environment variables. And also to run my application web server, I am applying the ddtrace-run command to my Uvicorn ASGI web server. You can find more configuration options in the advanced usage section.
./run-webapp.sh
Then I can run my bash script in the terminal.
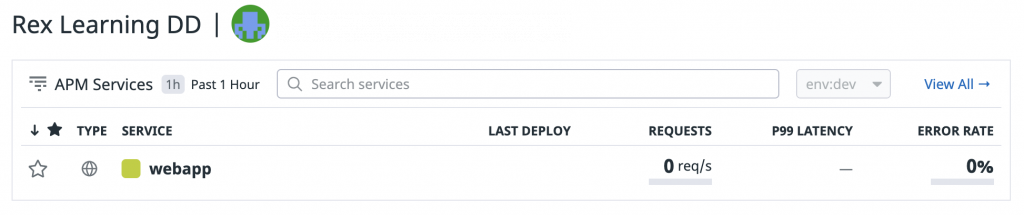
Now try opening in your browser the URL of your web application and give it a minute before checking again the APM page in your Datadog account. For this tutorial, I deployed my web application in an EC2 instance. Therefore, I get a Public IPv4 DNS that points to my server (e.g. http://ec2-00-000-000-00.us-east-2.compute.amazonaws.com). If everything has been set up properly, you should be able to see your new APM service.
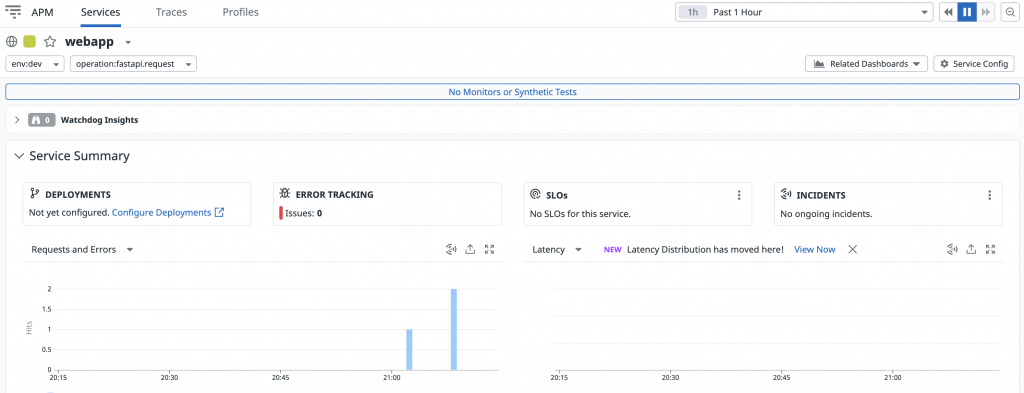
If you go to your APM Service dashboard, you will see many useful reports in the Service Summary. Such as number of requests, errors and latency.
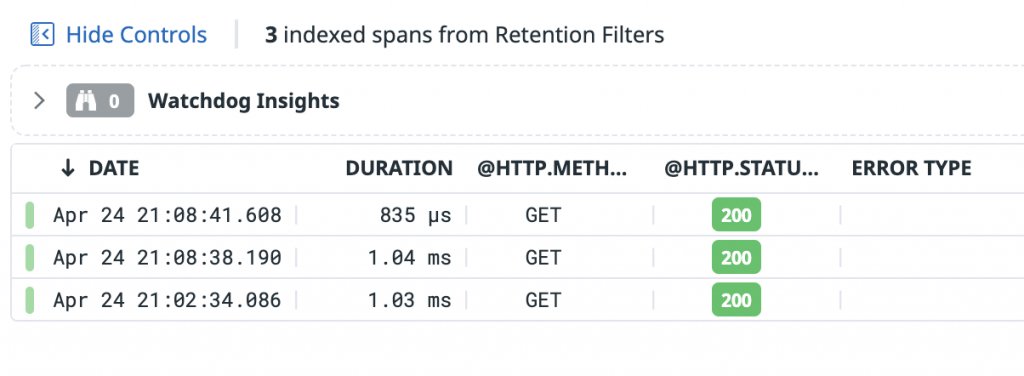
If you drill down in the report, you can access each requests made to your application.
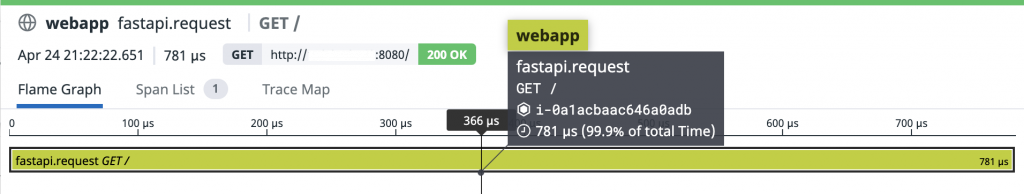
And if you drill down further by clicking on each requests, you will find even more granular reports such as Flame Graph, Trace Map, Span List, Tags, Logs and more.
Datadog APM Flame Graph and Trace Map
Datadog APM can also show in the dashboard how your applications are communicating with each other. In this tutorial I created my second web application named webapp-extension that accepts a timestamp value as a query parameter.
from fastapi import FastAPI

app = FastAPI()

@app.get("/")
async def root(timestamp):
    return {"webapp-extension": f"Timestamp {timestamp}"}
Also, I updated the main module in my first web application webapp so that it will send a GET request to webapp-extension. To do this, I am using the requests library.
from fastapi import FastAPI
import requests
import time

app = FastAPI()

@app.get("/")
async def root():
    response = requests.get(f"http://ec2-11-111-111-11.us-east-2.compute.amazonaws.com:8081/?timestamp={time.time()}")
    webapp = {"webapp": "Hello World"}
    webapp.update(response.json())
    return webapp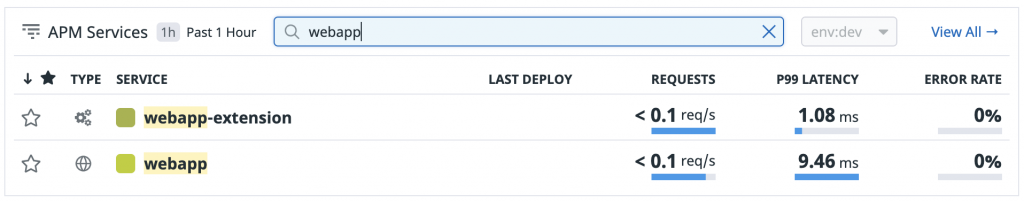
Now, when I access again the URL for my webapp it should return a JSON value. I’d give it a minute or two and view the report again in my Datadog dashboard. This time, I’m getting the second APM service for webapp-extension.
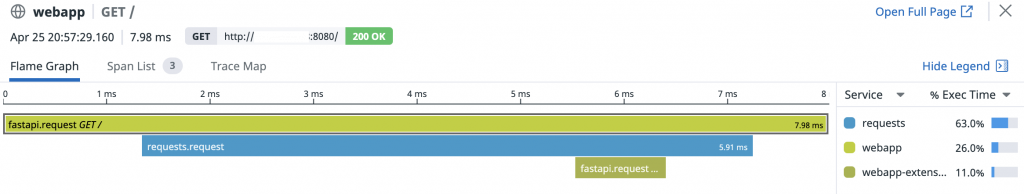
And to show you the latest request on my webapp’s Flame Graph, it displays the flow of the HTTP request between my applications. The requests library sending an HTTP GET to webapp-extension. You can also see the “% Exec Time” that could become helpful when debugging bottlenecks in your application response time.
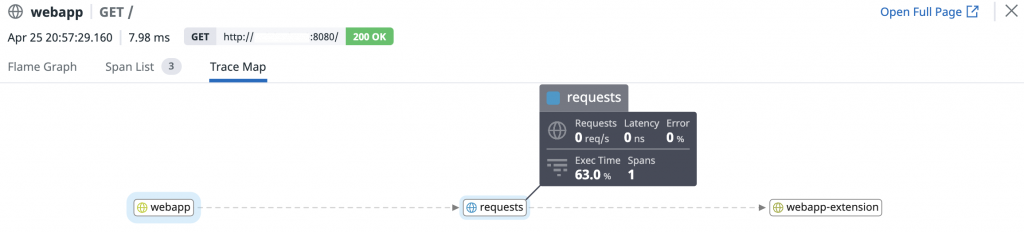
Trace Map has some useful and fancy graphs also to show you how the applications are connected.
Next for my tutorial, I will discuss how you can manage your logs in Datadog and associate this with APM using trace injection.